
Crandall Lab Update: What can we do with synthetic trees?
Currently, the Crandall Lab is examining ways to use the underlying OpenTree taxonomy to gather metadata, associate it with nodes and tips in our synthetic trees, and apply it to evolutionary studies. Below we discuss them in the context of ongoing projects in the lab.
Curated taxonomy
One of the major outcomes of the OpenTree project is the underlying taxonomy. A curated taxonomy allows us to search and align names across independent databases to pull out additional information to associate with node and tip names. The Crandall Lab taxonomy curation started with the freshwater crayfish, which are in the Infraorder Astacidea and includes 711 species spread among 7 families. This was a great group to start with because of the limited number of species and there are only a few active systematists revising the alpha-taxonomy, which makes the literature less dense and easier to work with. Initially, our investigations deemed the taxonomy very accurate, but the main issue we had to contend with was spelling errors attributed to depositing sequences into GenBank. In all, we identified and removed 10 misspelled taxa. Although that seems small, it was a great warm-up for two larger groups we are now working on, the Decapoda (crabs, shrimps, lobsters) which includes ~15,000 species and the Hemiptera (true bugs) which includes ~ 50,000-80,000 species.
Using a curated taxonomy to obtain additional data
As mentioned above, once the names have been curated we can use them to search across databases. This has been extremely useful in obtaining additional metadata to associate with our synthetic trees. For example, the Crandall Lab recently published a synthetic tree of the crayfish (Fig. 1), which included IUCN Red List values plotted for those taxa with assigned values (Owen et al. 2015, Richman et al. 2015). This is only feasible because we are able to search across IUCN Red Listed crayfish species using the OpenTree curated taxonomy names.
Other applications of using a curated taxonomy to obtain metadata include searching across GenBank to identify whether a particular taxon or rank has molecular data associated with it. This is useful for determining sampling strategies for new and continuing studies. For example, using the OpenTree taxonomy to search GenBank for Hemiptera families and genera, we found a wealth of sequence data has been generated for most of the higher taxa. The most diverse suborder within Hemiptera is Heteroptera and our query of names against NCBI GenBank suggests 70 of the 83 described families within Heteroptera have sequence data for one or more of the traditional eight molecular loci used in Hemiptera systematics (Fig. 2A). As for the Hemiptera genera identified in GenBank, we are currently validating the numbers in Fig. 2B because Hemiptera alpha-taxonomy is very active because many species are vectors for human pathogens and agricultural pests (e.g., kissing bug, aphids, psyllids, etc.).
In addition to searching GenBank, we are currently associating geographic, morphological, and ecological metadata to our curated names through GBIF and EOL TraitBank. We believe the curated OpenTree taxonomies of these groups and the accumulation of metadata for taxa will surely add a new dimension to our evolutionary studies and allow us to expand the scope the questions we can answer.
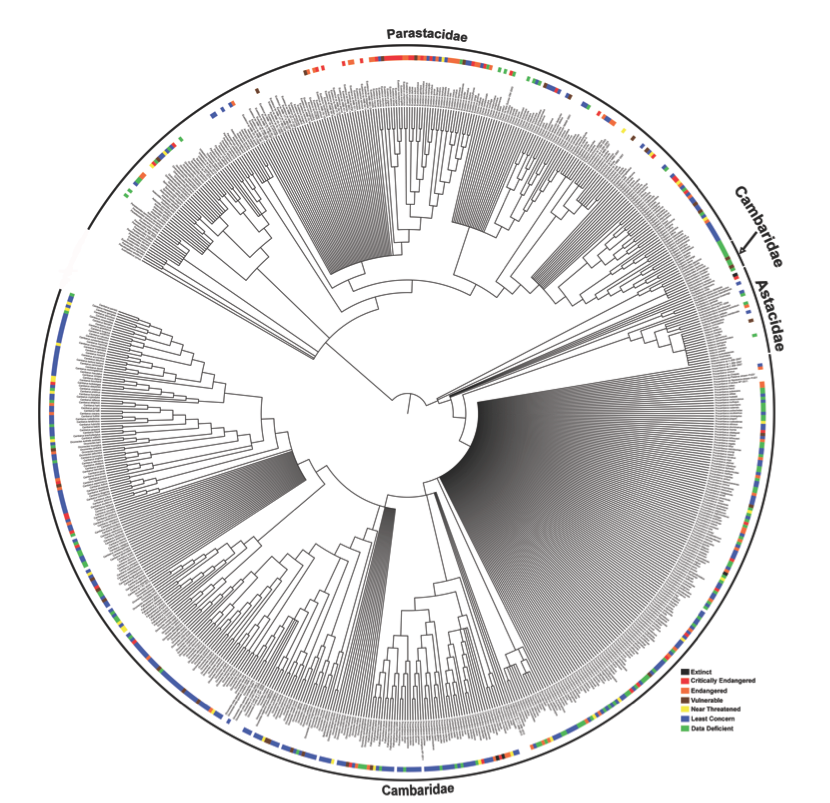
Figure 1 Synthetic tree of crayfish with 20 source trees. Family names noted on the edge of the synthetic tree. Paraphyly of Cambaridae is not novel and needs to be addressed in a morphological revision. Color blocks note the IUCN Redlist value.

Figure 2 Histograms depicting number of sequences found on GenBank given OTT names. 2A) Hemiptera families within suborders with nucleotide sequence data on NCBI GenBank. 2B) Hemiptera genera within suborders with nucleotide sequence data on NCBI GenBank.
Keith Crandall is a professor and director of the Computational Biology Institute at George Washington University.
Chris Owen is a post-doctoral researcher for the AVAToL grant.
Literature
Why Do We Need Big Trees, Anyway?
An explicit goal of the Open Tree of Life is to create a single phylogenetic tree that encompasses all living (and some extinct) biodiversity on earth. A question some may have, especially non-scientists, is why do we need a tree like that, and what would we do with it? You can’t even see it all at once, right? The answer to this question, of course, is that with bigger and more resolved trees we can answer evolutionary questions on scales not previously possible.
Currently, postdocs from the labs of Doug Soltis (Univ. of Florida) and Stephen Smith (Univ. of Michigan) are collaborating on several projects within the plant world that leverage the power of big trees. Cody Hinchliff, a postdoc in the Smith lab, recently presented some of these findings during a standing room only presentation at the Botanical Society of America conference in Boise, Idaho, employing a tree with almost complete generic level sampling to unravel evolution and diversification of epiphytes across vascular plants. Perhaps most surprisingly, Hinchliff found that most epiphyte lineages are relatively young, suggesting that either the widespread success that epiphytes currently exhibit is a recent phenomenon, or that epiphytic lineages are relatively short lived and evolve opportunistically in response to large-scale climate fluctuations. This, and other associated findings, are novel and exciting discoveries, and are examples of the insights that can be gleaned by analyzing character data across a massive data set.
Other collaborative “big tree” projects involving the Soltis and Smith labs involve the evolution of the aquatic habit within land plants and the evolution of floral characters in the order Lamiales. These studies involve Hinchliff and Stephen Smith, Bryan Drew from the University of Nebraska at Kearney (formerly a postdoc with Doug Soltis) and Doug Soltis, and undergraduates from all three institutions. The aquatic evolution project is looking at how the re-colonization of aquatic plants is linked to lineage diversification and whether an aquatic habit is associated with other character or habitat traits. The focus of the Lamiales study is investigating what suites of floral characters may be responsible for the extraordinary evolutionary success of the lineage, which at 23,000 species comprise about 1/12th of all flowering plants.
The fact that studies of this magnitude are not only possible, but ongoing, is a testament to the utility of big trees. Because these trees are nearly complete in terms of genera, we can account for virtually all diversity across these clades. Sparse lineage sampling and hence unaccounted for diversity has previously been a hindrance when analyzing evolutionary trends that span the tree of life, but the time is approaching (or might be here already!) where the size of the phylogenies will not be the limiting factor in studying broad scale evolutionary questions. This exciting development leaves researchers more time to examine and ponder truly interesting questions that could not be addressed previously. This is the power that big trees give us, and this is one of the reasons we need big trees.

Chronogram showing epiphytic evolution within vascular plants. Epiphytic lineages are shown in orange, and likely branches of epiphytic origin are in red. Root of tree is ~485 million years old.
Doug Soltis is a distinguished professor at the University of Florida.
Bryan Drew was previously a post-doctoral researcher in the Soltis lab and is currently an assistant professor at the University of Nebraska-Kearney.
A push for fungal phylogenies in the Open Tree of Life
 The summer of 2014 was a busy one for the mycology group in the Open Tree of Life. Postdoctoral Fellow Romina Gazis gave presentations on the Open Tree of Life at the Annual Meeting of the Mycological Society of America (June 8-12, East Lansing, Michigan) and the International Mycological Congress (Aug. 3-8, Bangkok, Thailand). You can download the IMC presentation here.
Meanwhile, back in Worcester, we continued to compile published phylogenetic trees for incorporation into the Open Tree database. Our goal is to create a synthetic tree that represents, as closely as possible, our current understanding of the broad outlines of fungal phylogenetic relationships, based on molecular studies and taxonomy in Index Fungorum and other sources. We plan to use the tree as the centerpiece of a revision of “higher level” fungal taxonomy, updating a study that we published with seventy coauthors way back in 20071.

Dr. Romina Gazis is a postdoc at Clark University. Dr. Gazis specializes in systematics of endophytes, including symbionts of rubber trees (Hevea brasiliensis) and the newly-described class Xylonomycetes, and also works on phylogenies for the Open Tree of Life project.
To this end, we reviewed the recent and not-so-recent fungal biology literature, emphasizing studies that made a major contribution to understanding of higher-level relationships. We thus identified 314 important studies that are a priority for inclusion in Open Tree of Life. The list of “critical” higher-level studies can be viewed here. Mycologists reading this blog post may wish to check our list of references, and let us know if we have missed anything! Please realize that at this point, we are prioritizing studies that resolve major clades, or that have particularly strong sampling of large groups.

Jiaqi Mei is an undergraduate research assistant at the Katz Lab at Smith College. Jiaqi has been working on gathering information on missing phylogenies for the Open Tree of Life project. Photo: Katz Lab
Having identified the critical higher-level analyses, our next job was to search for the phylogenies in TreeBase and upload them to Open Tree of Life via PhyloGrafter. We were assisted in this time-consuming work by Jiaqi Mei, an undergraduate from Laura Katz’s lab at Smith College who joined us for the summer. 119 of the 314 “higher level” studies (38%) had studies available in TreeBase or other sources. In contrast, Drew et al. (2013)2 found that only about 17% of published phylogenetic studies from all groups have available phylogenies . This evidently demonstrates that mycologists who look at “big picture” phylogenetic relationships are particularly conscientious about data deposition! Nonetheless, there were still many missing phylogenies, so Jiaqi and Romina initiated an e-mail campaign, reaching out to authors of the 195 critical higher-level studies for which we had no trees. We are very grateful to have received responses from almost 50 authors so far. If you are among those who replied to our plea for data, we want to take this opportunity to say Thank You! You should have received a note from us—if not, something may have been lost in transit—please write again!
Our immediate goal is to compile phylogenies that address higher-level relationships, but we are not neglecting fungal studies at low taxonomic levels. In fact, one of Jiaqi’s major tasks was to update our literature review of all fungal phylogenies, reviewing publications since the 2013 study of Drew et al.2, which included studies published up to 2012. Overall, we have identified 2314 fungal phylogenetic studies published since 2000 in 17 journals, of which 640 (28%) have associated treefiles.
It is hard to believe that the Open Tree of Life Project is already in its third year. Our major goal by the end of this academic year is to produce a synthetic phylogenetic tree that significantly updates the 2007 “AFTOL Classification”1 of Fungi, with direct connections to taxonomy and diverse phylogenetic studies. With the continued cooperation of the mycological community we are optimistic that we will reach this goal.
1Hibbett, D. S., M. Binder, J. F. Bischoff, M. Blackwell, P. F. Cannon, O. E. Eriksson, S. Huhndorf, T. James, P. M. Kirk, R. Lücking, T. Lumbsch, F. Lutzoni, P. B. Matheny, D. J. Mclaughlin, M. J. Powell, S. Redhead, C. L. Schoch, J. W. Spatafora, J. A. Stalpers, R. Vilgalys, M. C. Aime, A. Aptroot, R. Bauer, D. Begerow, G. L. Benny, L. A. Castlebury, P. W. Crous, Y.-C. Dai, W. Gams, D. M. Geiser, G. W. Griffith, C. Gueidan, D. L. Hawksworth, G. Hestmark, K. Hosaka, R. A. Humber, K. Hyde, J. E. Ironside, U. Kõljalg, C. P. Kurtzman, K.-H. Larsson, R. Lichtwardt, J. Longcore, J. Miądlikowska, A. Miller, J.-M. Moncalvo, S. Mozley-Standridge, F. Oberwinkler, E. Parmasto, V. Reeb, J. D. Rogers, C. Roux, L. Ryvarden, J. P. Sampaio, A. Schüßler, J. Sugiyama, R. G. Thorn, L. Tibell, W. A. Untereiner, C. Walker, Z. Wang, A. Weir, M. Weiß, M. M. White, K. Winka, Y.-J. Yao, N. Zhang. 2007. A higher-level phylogenetic classification of the Fungi. Mycological Research 111: 509-547. <http://www.clarku.edu/faculty/dhibbett/Reprints%20PDFs/Hibbett_et_al_AFTOL_class_2007.pdf>
2Drew, B.T., R. Gazis, P. Cabezas, K.S. Swithers, J. Deng, R. Rodriguez, L.A. Katz, K.A. Crandall, D.S. Hibbett, D.E. Soltis. 2013. Lost branches on the tree of life. PLOS Biology 11:e1001636. http://www.clarku.edu/faculty/dhibbett/Reprints%20PDFs/added_pdfs_Feb_2013/Drew_et_al_2013_LostBranchesOnTheTreeOfLife_PLOSbiology.pdf
David Hibbett is a professor of biology and PI of the Hibbett lab at Clark University.
Romina Gazis is a postdoc at Clark University.
Which came first? A pivotal position in the plant tree of life

Amborella trichopoda
The question of which extant angiosperm (flowering plant) lineage “came first” (i.e., is basal in the flowering plant tree of life) has long puzzled biologists. This question is fascinating and important in its own right, but the answer also has potentially profound ramifications including plant gene and genome evolution (which, for example, has implications for crop improvement). Such information is also important for understanding habit and habitat evolution and for the inference of ancestral character states in the angiosperms (e.g., the ancestral flower as well as the ancestral angiosperm genome). Although great 20th century plant taxonomists such as Arthur Cronquist, Armen Takhtajan, and Robert Thorne generally agreed that taxa from the subclass Magnoliidae comprised the “basal” angiosperm lineage, there was no way to “prove”, one way or another, which extant angiosperm lineage came first until the advent of molecular systematics towards the end of the 20th century.
With the aid of modern molecular phylogenetic techniques it is now known that the major groups they recognized, such as Magnoliidae sensu Cronquist and Takhtajan, are typically polyphyletic. Most research now indicates instead that Amborellaceae, Nymphaeales (water lilies), and Austrobaileyales are the earliest branching extant angiosperm lineages. However, the relative branching order of these three lineages, particularly in regards to Amborella trichopoda (the sole species within Amborellaceae) and Nymphaeales, was, until recently, somewhat contentious.
While most molecular analyses during the past 20 years have recovered Amborella as the earliest-diverging angiosperm lineage, some studies have suggested a clade comprising Amborella + Nymphaeales, or even Nymphaeales alone, as the root of all angiosperms. Recently, at the University of Florida, Soltis lab postdoc Bryan Drew and colleagues (including AVATOL team member Stephen Smith at the University of Michigan) endeavored to definitively answer the longstanding question of which angiosperm came first—that is, what living angiosperm is sister to all other living angiosperms in the angiosperm tree of life. Using a plastid data set consisting of 236 taxa, 78 genes, and ~58,000 nucleotides, Drew et al. performed a myriad of analyses with the express purpose of discerning the first-diverging angiosperm lineage; this study by Drew et al. was just accepted by Systematic Biology and will be viewable online in the coming months. Their results: Virtually every analysis conducted found Amborella as the earliest-diverging living angiosperm lineage with high internal support, and every plastid analysis performed using their original datasets recovered a topology in which Amborella alone is sister to all other living angiosperms.
 These findings lend strong affirmation to the Amborella sister hypothesis, and should help guide future research regarding angiosperm character (including genomic features) and habitat evolution. Although the “first” angiosperms are long extinct, a better understanding of Amborella will aid in our understanding of angiosperm evolution as a whole. This was the impetus behind the Amborella Genome Project. As a result of this ongoing project, the Amborella nuclear genome has recently been fully sequenced (www.amborella.org; Amborella Genome Project, Science, in press), and this major achievement should lead to unprecedented insights within flowering plants.
Doug Soltis is a distinguished professor at the University of Florida.
Bryan Drew is a post-doctoral researcher in the Soltis lab at the University of Florida.
How computer scientists are using map distance to determine phylogeny
What is distance?
Distance is a way to measure the relatedness of two things. It is phrased in terms of similarity or difference relative to a feature. Different features expose different information about how the things are related. For instance, if we compare two cities, we might compute their geographical distance or how far apart they are in terms of miles or kilometers. But, if we are making a car trip, we may want to compute a different distance. Roads rarely directly connect two points, so we may care more about the driving distance or driving time. On the other hand, if we’re looking for somewhere warm to spend the winter, we may care most about the difference between the temperatures of two cities.
Distance is a requirement for comparison. It fundamental to the assessment data required by scientific pursuits as well as the value judgments made in our daily lives. Thus, distance is a cornerstone of the human experience.
What does distance tell us about trees?
 Consider four phylogenies over the genus Panthera or big cats shown below. Here, the trees are from actual phylogenetic analyses performed by different researchers over the years. The fourth tree is the current best estimate of the big cats by Davis, Li, and Murphy. (For further details, see their 2010 paper “Supermatrix and species tree methods resolve phylogenetic relationships within the big cats, panthera (carnivora: Felidae)” in Molecular Phylogenetics and Evolution.)
There are different trees because researchers use different combinations of phylogenetic reconstruction methods and phylogenetic data. Typically, these discrepencies are resolved by a consensus tree where relationships are included in the consensus tree if they appear in either most of the trees (majority consensus) or all of the trees (strict consensus). For our example, the majority consensus tree only retains one relationship as shown below. Most of the information from the trees is lost, which is one disadvantage of summarizing a set of trees with a single consensus tree.
In our example, the consensus shows that there is not much in common among the four trees. But, if we look at distance, we could gain more information. For example, which of the trees are most closely related? In phylogenetics, distance is generally defined by relationships defined by bipartitions. A bipartition is an edge that when removed separates the tree into two partitions. Assume that C, S, T, J, L, and N represent Clouded Leopard, Snow Leopard, Tiger, Jaquar, Leopard, and Lion, respectively. For tree 1, the bipartitions are C|STJLN, CS|TJLN, CST|JLN, CSTJ|LN, and CSTJL|N. Bipartiton C|STJLN means there is an edge that when removed has one partition containing Clouded Leopard and the other partition containing Snow Leopard, Tiger, Jaquar, Leopard, and Lion. We can compute the Robinson-Foulds (RF) distance between two trees Ti and Tj by counting the number of bipartions in Ti but not in Tj and adding that to the number of bipartions in Tj but not in Ti. The RF distance is then this sum divided by 2. Based on the RF distance matrix of our big cat trees shown below, Trees 1 and 4 as well as Trees 3 and 4 are the closest trees since they have the smallest RF distance of 1.

In our example, the consensus shows that there is not much in common among the four trees. But, if we look at distance, we could gain more information. For example, which of the trees are most closely related? In phylogenetics, distance is generally defined by relationships defined by bipartitions. A bipartition is an edge that when removed separates the tree into two partitions. Assume that C, S, T, J, L, and N represent Clouded Leopard, Snow Leopard, Tiger, Jaquar, Leopard, and Lion, respectively. For tree 1, the bipartitions are C|STJLN, CS|TJLN, CST|JLN, CSTJ|LN, and CSTJL|N. Bipartiton C|STJLN means there is an edge that when removed has one partition containing Clouded Leopard and the other partition containing Snow Leopard, Tiger, Jaquar, Leopard, and Lion. We can compute the Robinson-Foulds (RF) distance between two trees Ti and Tj by counting the number of bipartions in Ti but not in Tj and adding that to the number of bipartions in Tj but not in Ti. The RF distance is then this sum divided by 2. Based on the RF distance matrix of our big cat trees shown below, Trees 1 and 4 as well as Trees 3 and 4 are the closest trees since they have the smallest RF distance of 1.
What tools exist for computing tree distances?
One of the main focuses in our lab is designing high-performance algorithms for comparing trees. For computing RF distances between thousands of trees, we have designed the algorithms HashRF and MrsRF. Besides bipartions, quartets are also used for describing the relationships in a tree. Whereas a bipartition shows the relationship between all of the taxa in a tree, a quartet is based on 4 taxa. Similarly to bipartitons, we can then use quartets to compare trees. To compute the quartet distance quickly, we have designed the Quick Quartet algorithm. Finally, an interesting consequence of tree distance is that we can use it to compress collections of trees. If trees have much in common, they can be stored in a smaller representation. Our TreeZip algorithm is a first step in the direction of compressing phylogenetic trees.
How can distance measures help us build the Tree of Life?
Distance measures are essential in the synthesis of new trees into the ToL. If for a particular set of taxa the distances are large, this could mean there is significant disagreement on the relationships in that part of the ToL. On the other hand, if the trees are close in terms of distance, there is evidence for substantial agreement within the trees. For trees being added to the ToL, distances can help guide the integration of the new trees. Large distances may require significant manual curation to integrate the trees whereas small distance indicate substantial agreement with the existing ToL and allow the curator to focus on a smaller set of trees.
Tiffani Williams is an assistant professor in the department of computer science at Texas A&M University.
Ralph Crosby is a graduate teaching assistant at Texas A&M University.
Grant Brammer is a graduate teaching assistant at Texas A&M University.
Mapping the Tree of Life: the ARBOR Project

Open Tree of Life met with ARBOR, a program funded by the National Science Foundation, to talk about what changes have been made featuring the synthetic tree of life. We spoke with Dr. Luke Harmon, an associate professor at the University of Idaho’s department of Biology. Dr. Harmon has been using comparative biology to determine what the tree of life can tell us about evolution over long time scales.
What has ARBOR been working on right now?
Comparative Biology is at the heart of the ARBOR project. Using the evolutionary relationships among species, we can learn something about trait evolution and the formation of new species. For example, there really is no basic ‘ladder of life’ stemming from simpler organisms to more complex; instead, evolution varies among groups and through time in complex and interesting ways. It’s hard to do what we do with traditional tools. Instead, we have to use new tools to analyze how species have diversified to generate the tree of life
How have phylogeny studies changed over time?
A lot of progress has been made in the last twenty years regarding our understanding of the relationships among different species. We now know a lot more about how species are related to one another and how they evolved from their common ancestors. The Open Tree of Life is the best possible example of this sort of synthesis – it’s almost like the human genome project in that it is generating a very good map that will connect all organisms on earth in a single phylogenetic tree. One problem, though, is that there is just so much information contained in large phylogenetic trees, and we don’t always know how to extract information about how organisms evolve. ARBOR is developing tools to read the stories of evolution from these phylogenies.
The Crandall lab explores solutions to incomplete phylogenies
The Crandall Lab is in charge of uploading and curating animal studies for the AVAToL-Open Tree project. Chris Owen, postdoctoral researcher, has been leading this portion of the project for the animals beginning in March 2013. To date, the Crandall Lab has contributed over 400 studies and sent requests for over 100 studies for authors to contribute their phylogenies to the Open Tree project.
Similar to the Solitis Lab group, the Crandall Lab success rate for obtaining published phylogenies directly from authors has been rather low. As a result, many animal lineages are currently represented in the Open Tree as taxonomic graphs. One example of a poorly sampled group is the decapods (crabs, crayfish, lobsters, prawns, and shrimp). Dr. Keith Crandall has studied decapods most of his career and his phylogenies generate a well-sampled backbone, but each higher taxon is represented by few species. Many researchers want to use the tree for some downstream analysis that benefits from sampling all species; therefore, at this stage of the project one must ask, “How can I obtain a phylogeny of all species for my favorite group, if the only thing available in Open Tree is a well-resolved backbone, while lower taxonomic ranks are represented primarily by unresolved taxonomic graphs?”.
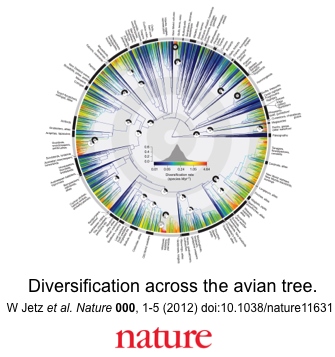
Recently, a paper was published in the journal Nature that may present a workaround for people who wish to obtain a mostly bifurcating comprehensive phylogeny, although only a bifurcating backbone is available on OpenTree. The published study by Jetz et al. (2013) aimed to use a phylogeny of birds to explore changes in speciation and extinction rate through time, while also mapping all bird diversity, to gain insight into bird evolution. In order to explore these characteristics of bird evolution, the authors first needed a phylogeny of birds that included all species. However, no such phylogeny has ever been published and the most comprehensive bird phylogenies available at the time of the study did not contain all species for each crown clade. Their solution to generating a phylogeny of all birds began first by assigning each avian genus to a crown clade represented in the backbone phylogenies. Next, sequence data for a set of loci for each species in a crown clade was downloaded from public databases and the phylogeny was estimated using Bayesian inference. Since the crown clades of the backbone tree contain taxa also in the newly estimated crown phylogenies, the newly estimated crown phylogenies were sub-sampled with the backbone phylogenies to generate a pseudo-posterior distribution of complete avian phylogenies, which was used to depict the avian phylogeny with all species for downstream analyses.
As the organismal labs continue to track down studies and wait for requested published phylogenies, a method such as this may be a temporary solution to obtain mostly bifurcating phylogenies for lineages not well-represented by source trees. Furthermore, variations of this theme could also be used. For example, one could estimate a single tree for each crown clade and merge each tree with the Open Tree phylogeny that has a well-resolved backbone that has unresolved recent clades, using Open Tree Software, and ultimately create a synthetic tree for your favorite group.
These are a couple of potential methods to generate comprehensive phylogenies using the Open Tree for poorly resolved lineages represented only by taxonomy and we look forward to new ideas other researchers offer once the tree becomes public.
Keith Crandall is a professor and director at the George Washington University Institute of Computational Biology.
Chris Owen is a post-doctoral researcher for the AVAToL grant at George Washington University.
The Soltis lab fills the gaps in green plant phylogeny for the Open Tree of Life
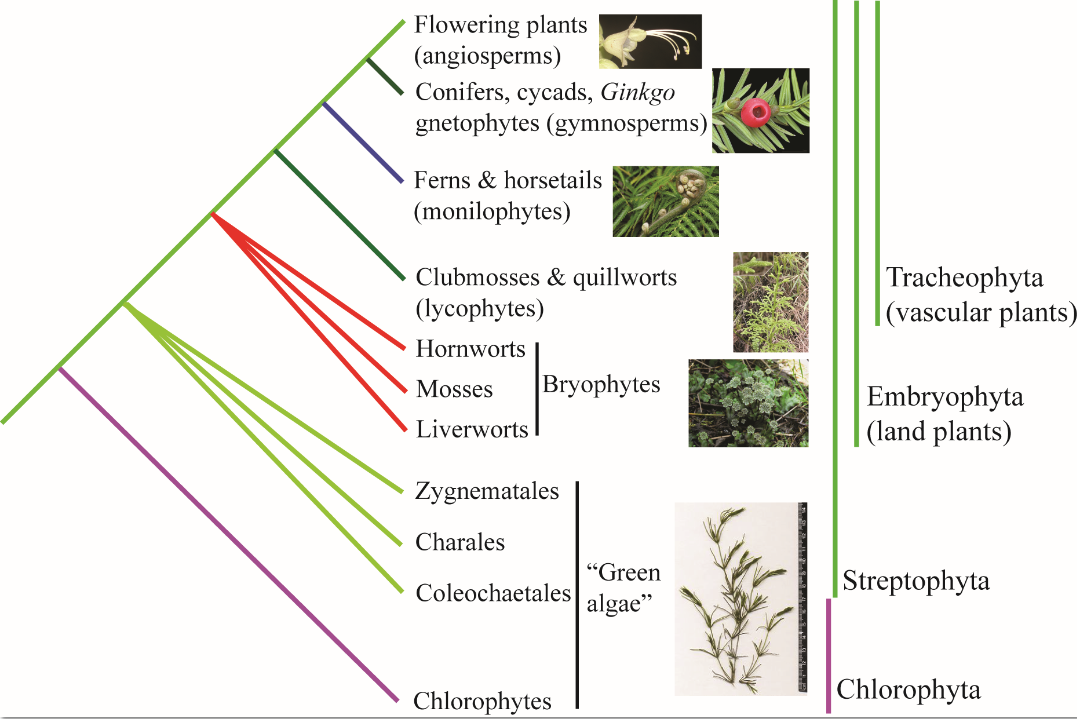
Phylogenetic tree summarizing relationships among major lineages of green plants (Viridiplantae)
In the Soltis lab at the University of Florida, Bryan Drew and Jiabin Deng have spent much of the past year collecting trees and alignments of green plants (Viridiplantae) as part of an effort to produce a synthetic tree that represents all of the described organisms on Earth. As part of the tree-gathering process, they have gleaned public database archives and contacted corresponding authors directly to request data. Although these methods were not as successful as had been hoped, they recovered trees from over 1000 publications involving green plants.
As might be expected, some areas of the green plant tree are better resolved than others. For example, within gymnosperms and flowering plants we have authorsubmitted trees that support the monophyly of most major lineages, but for other major lineages of green plants, such as green algae and bryophytes, sampling is not as complete and those parts of the tree are not as well resolved. Fortunately, for green algae at least, help is on the way in the form of the NSF funded “Assembling the Green Algae Tree of Life” project. Although results from this project will not be incorporated into the upcoming Open Tree of Life “Big Bang Tree”, within a few years the green algae portion of the Open Tree will undoubtedly greatly benefit by inclusion of trees from the Green Algae Tree of Life project. Other parts of the green plant tree are shaping up nicely, and the Soltis lab is sending out some last minute requests to authors in an attempt to shore up regions of the tree that are presently underrepresented.
Here we provide a basic summary of what we know about green plant phylogeny, stressing that there is much we still do not know about relationships in this large clade of perhaps 500,000 species. We know from the fossil record that many green plant taxa have gone extinct; these extinctions contribute to “long branches” in the Tree of Life and can make it very difficult to determine relationships between older lineages. In the green plant tree, two main clades have been recovered, the Chlorophyta and the Streptophyta. The chlorophytes contain most of what is traditionally known as green algae, while the streptophytes contain the remaining green algae as well as land plants (Embryophyta). One of the many insights provided by molecular systematics during the past twenty years is that “green algae” as long recognized are not actually a natural group (i.e., they are not monophyletic), and that some traditionally classified “green algae” are actually more closely related to land plants. However, the closest “green algal” relative of land plants remains unclear—some studies suggest Charales whereas others indicate Zygnemetales or Coleochaetales The land plants (embryophytes) include bryophytes (mosses, hornworts, and liverworts) and vascular plants (tracheophytes). There is still some question as to whether the bryophytes are a natural group or comprise separate evolutionary lineages. The vascular plants are comprised of lycophytes (clubmosses and quillworts), monilophytes (e.g., ferns and horsetails), gymnosperms (cycads, Ginkgo, gnetophytes, and conifers), and angiosperms (flowering plants).
Though the relationships of come large clades are uncertain, these uncertainties will be shown in the Big Bang tree given that we possess many of the trees that highlight these different clade placements. In other areas of the green plant tree we are sorely lacking data, and the Soltis lab (in close collaboration with Stephen Smith’s lab at the University of Michigan) is still working hard to fill in the tens of thousands of holes in the tree that remain. This is a beautiful part of the Open Tree of Life: as with the organisms that it represents, the tree is ever growing!
Doug Soltis is a distinguished professor at the University of Florida.
What do mycologists think about the tree of life?

Two Open Tree participants, Romina Gazis and David Hibbett, recently attended the annual meeting of the Mycological Society of America in Austin, Texas. Romina gave a presentation about the Open Tree of Life Project, which gave us a chance to hear some thoughts from our community. Questions (paraphrased) included the following:
“When the synthetic tree is available, will we be able to filter on a node-by-node basis, or just tree-by-tree? For example, will we be able to identify the strongly supported nodes in individual trees and then constrain the synthetic tree to include those nodes, but not other, weakly supported nodes?”
Capturing information about individual branches, such as support values and branch lengths, is difficult, and in some cases impossible, because the trees were deposited without such information included. It is possible to make decisions about priority on a node-by-node basis, but this requires decision-making by the individual performing the synthesis.
“Can this synthetic view of the tree be used to guide genome sampling priorities?”
Absolutely! In fact, the ongoing 1000 Fungal Genomes Project is already using taxonomy to guide sampling. Open Tree will be able to help in this effort by providing a comprehensive view of phylogenetic diversity of Fungi that will help identify clades that are poorly sampled. We will also be able to prioritize genome-based studies during synthesis, which should allow us to create trees based on a very robust backbone.
Numerous talks and posters at MSA concerned fungal phylogenetics and taxonomy. So much progress is being made! For example, there were presentations on systematics of chytrids, downy midlews, rusts, earth tongues, lichens, mushrooms, and many more. At the same time, in the course of developing the first synthetic trees for this project, it has become abundantly clear that the major centralized taxonomic resources, like Global Biodiversity Information Facility (GBIF) and National Center for Biotechnology Information (NCBI) have a hard time capturing phylogenetic knowledge. To be fair, it is unreasonable to think that any single organization can keep track of all the progress in taxon discovery and phylogenetic inference across the entire tree of life. Sitting in the audience at MSA, I wondered how long it would take for the trees being projected on-screen to be reflected in the taxonomy presented by organizations like GBIF or NCBI (or EoL , CoL, etc). Perhaps a new, community-based approach is needed for building a taxonomic commons?
For the .pdf file of Open Tree of Life’s Challenges and Progress for Fungi, check out Mycological Society of America 2013.
Dr. David Hibbett is a professor of Biology at Clark University.
